Build your own report and get down to the details in just a few clicks.
Fast Results
Matrix will automatically incorporate new information as soon as it is received and quickly develop reports for the user to view in a matter of seconds.
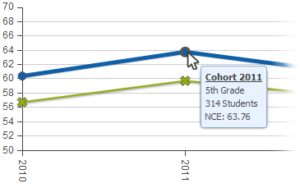
Cohort Analysis
Follow a group of students over their history and see how they compare to state, district, and grade averages.
Secure Access
Matrix allows each user access only to information specific to his or her needs to ensure that student data remains confidential and safe.
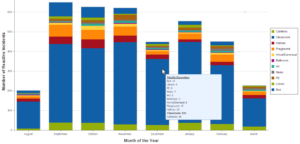
Behavior Data
A centralized place for recording and analyzing behavior referrals. View by school, student, type, location, time, and more.
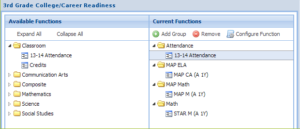
Key Performance Indicators
Standardize test scores and additional academic indicator areas like attendance into a readable and meaningful score.
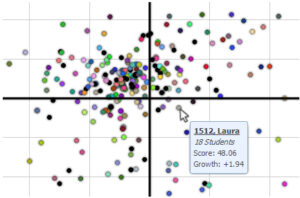
Teacher Growth
Measure the impact of classroom instruction and strategies.
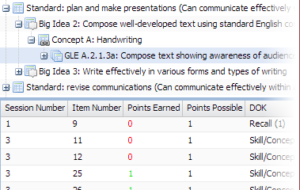
Standards and Subscores
Matrix has no limit on the number of data points, so bring along all the standard and subscore data you have.
Intuitive Interface
See information in an incredibly easy-to-read-and-understand way.
Printable Charts and Graphs
Save or print a chart or report with the simple click of a button.
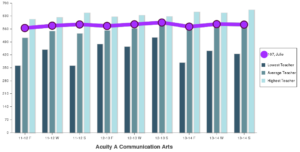
Teacher Collaboration
Compare student performance in a selected classroom with the lowest, average and highest averages of all classes for the same grade, subject and term throughout the district.
System Integration
We make sense of any combination of multiple-sourced data to integrate any system into Matrix.
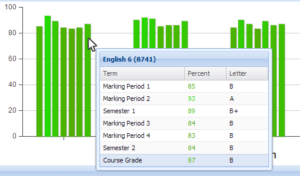
Classroom Grades
See classroom performance alongside state and other district-wide assessments.
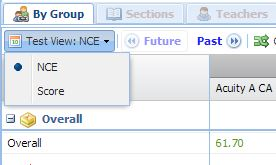
Grading Scales
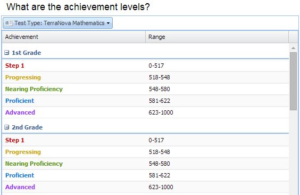
The Test View allows users to view the selected data on different grading scales (e.g. scale score, achievement, and Normal Curve Equivalent).
College Ready Progress
Track student progress on college readiness exams like EXPLORE, PLAN, and ACT.
Validated Data
Matrix provides users with instant validation by allowing them to click on an aggregated value and see where it was derived from.
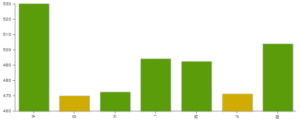
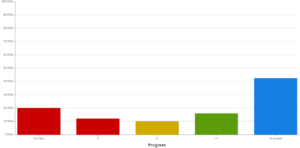
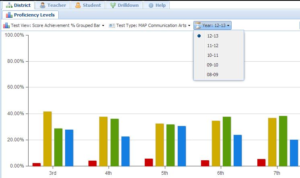
Interactive Charts
Animated and colorful charts make understanding trends easier and allow users to visualize data from an entire district standpoint.
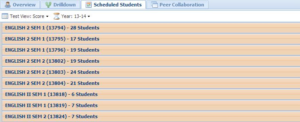
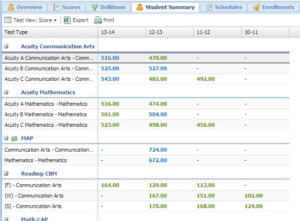
Student History
Includes student’s scores, schedules, and enrollments in one compact, easily printable grid.
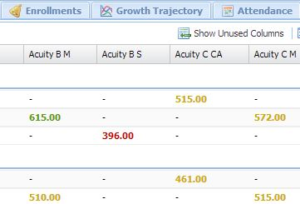
Self-Adjusting Grids
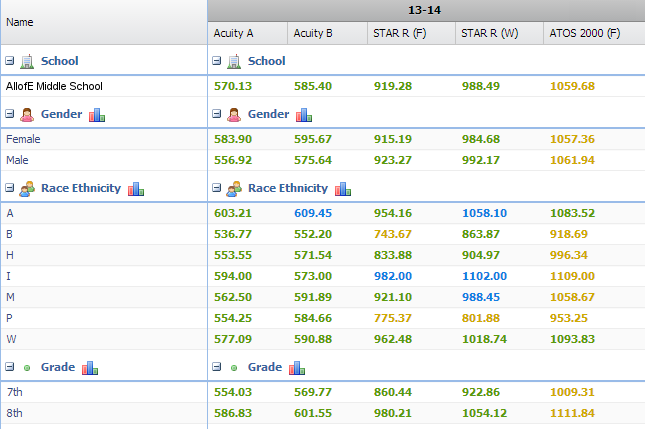
Automatically adjusting grids only show columns that have data to support many different types of test scores, and display them as efficiently as possible.
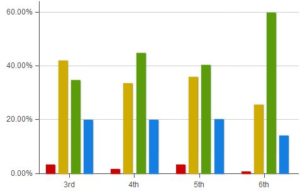
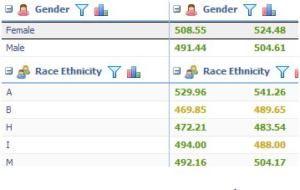
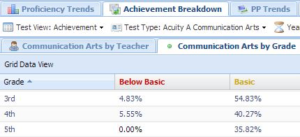
Achievement Breakdown
Easily see performance levels divided by subject and teacher, or by subject and grade(i.e., Mathematics by Teacher or Mathematics by Grade).
Historical Data
Easily view, compare, and navigate between current and past years data.
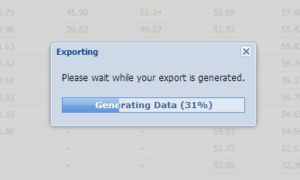
Data Export
Many of the grids in Matrix offer export functionality allowing users to transparently show all the data used in the system.
Combined Score Analytics
The Score Analytics Report unites tests like the State Assessment, Acuity, AIMSweb, EPAS, NWEA MAP, STAR, TerraNova, etc. with the district’s Student Information System into one central location.
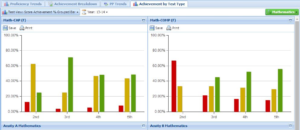
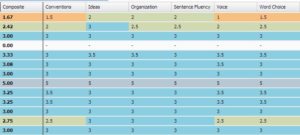
6+1 Traits Gradebook and Charts
This custom gradebook for the 6+1 Traits Assessments has interactive charts that allow the user to enter scores into each of the 6 writing trait categories and track how students perform across all of their classes.
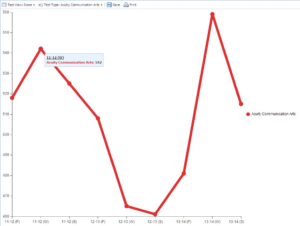
AYP Growth Reports
Detailed information on each student’s growth trajectory, targets and scores.
Constant Evolution
We are constantly developing more powerful and diverse reports. Check out our Recent Developments.
There’s More!
We have too many features to fit on one page – feel free to Contact Us for more information or your own demo.